You can have complete and detailed reports of all the subscriptions and recurring payments in the Dashboard section of the plugin. Here, you will find reports related to the most popular subscriptions, total incomes, renewals, trials, etc.
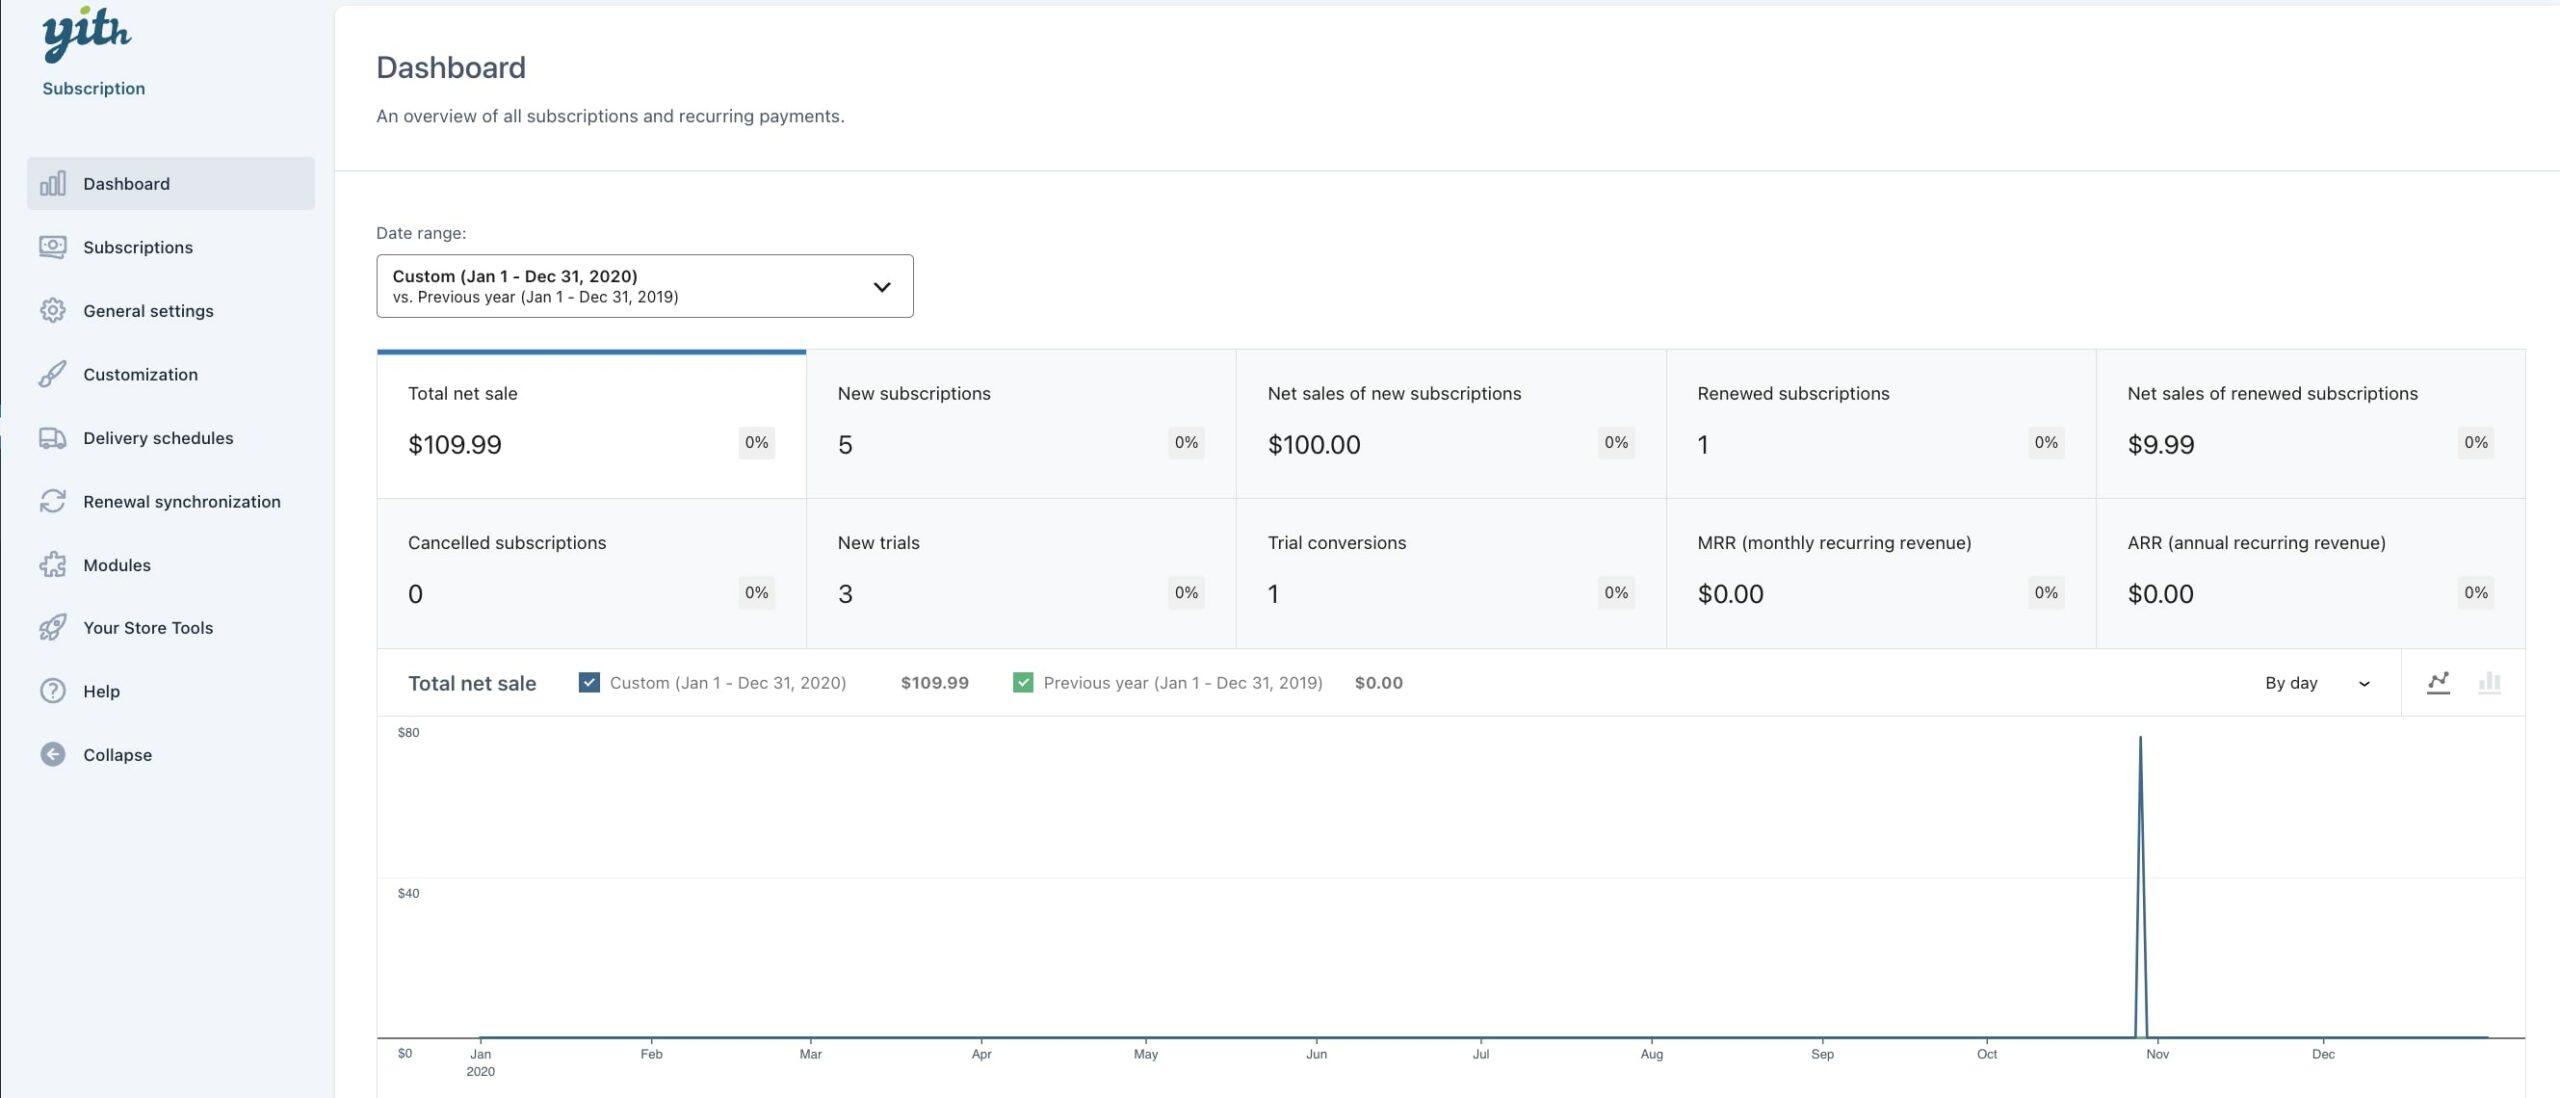
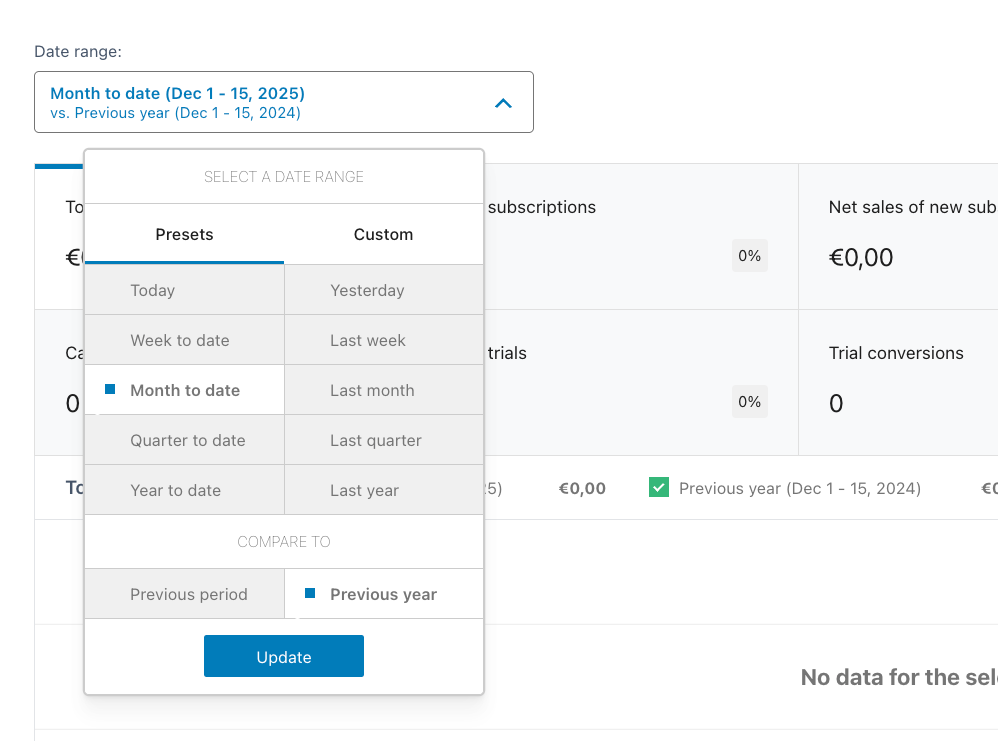
To show reports, you can choose a date range from presets (today, yesterday, week to date, last week, month to date, last month, quarter to date, last quarter, year to date last year) or a custom date range and compare it to the previous period or previous year.
You can get the different reports listed below:
- Total net sales
- New subscriptions
- Net sales of new subscriptions
- Renewed subscriptions
- Net sales of renewed subscriptions
- Cancelled subscriptions
- New trials
- Trial conversions
- MRR (monthly recurring revenue)
- ARR (annual recurring revenue)
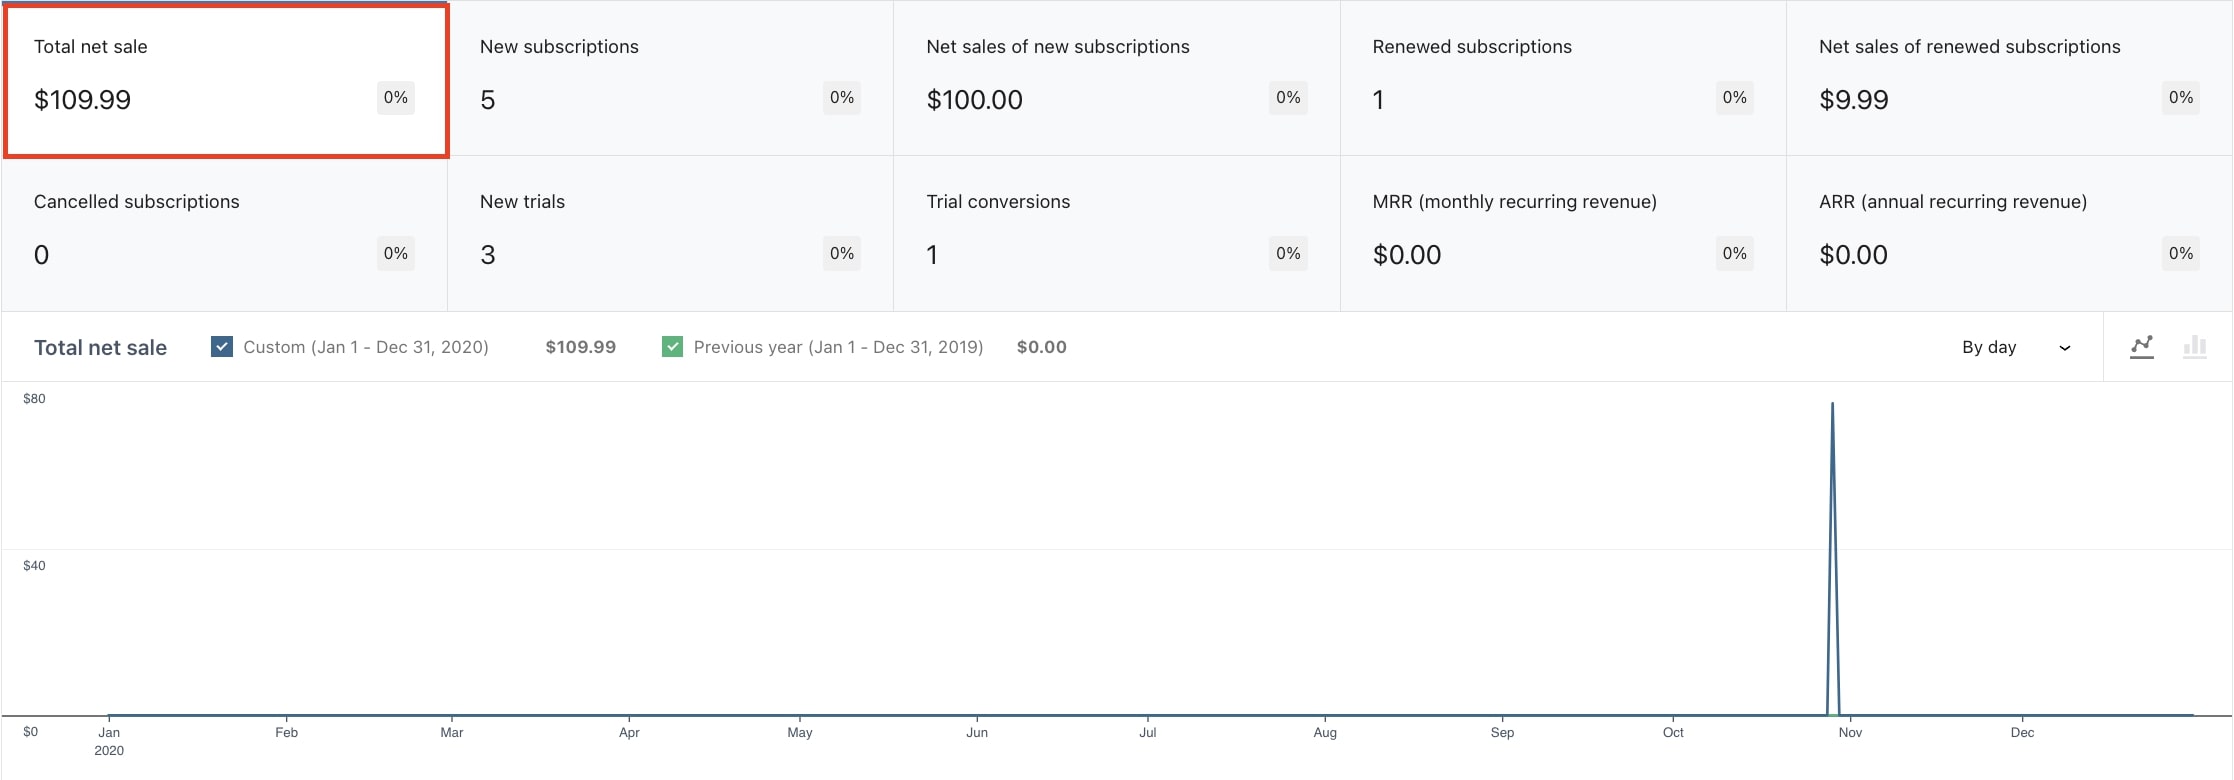
Total net sales
From the box Total net sales, you will be able to have a report of the net sales of your subscriptions based on the selected date range.
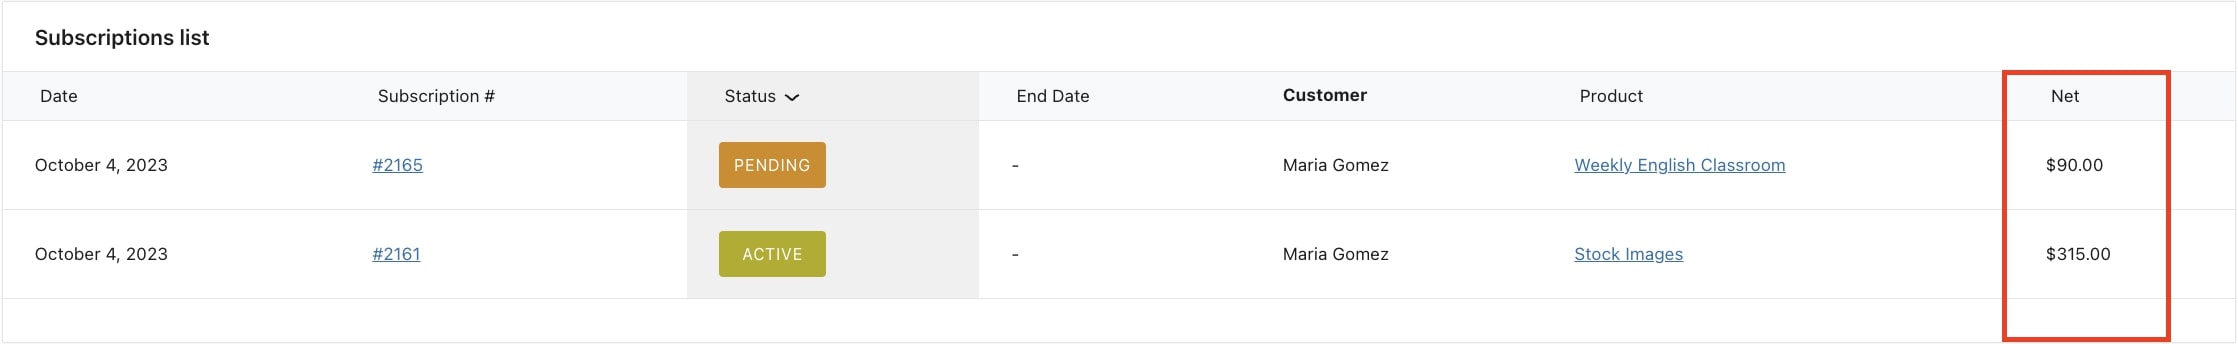
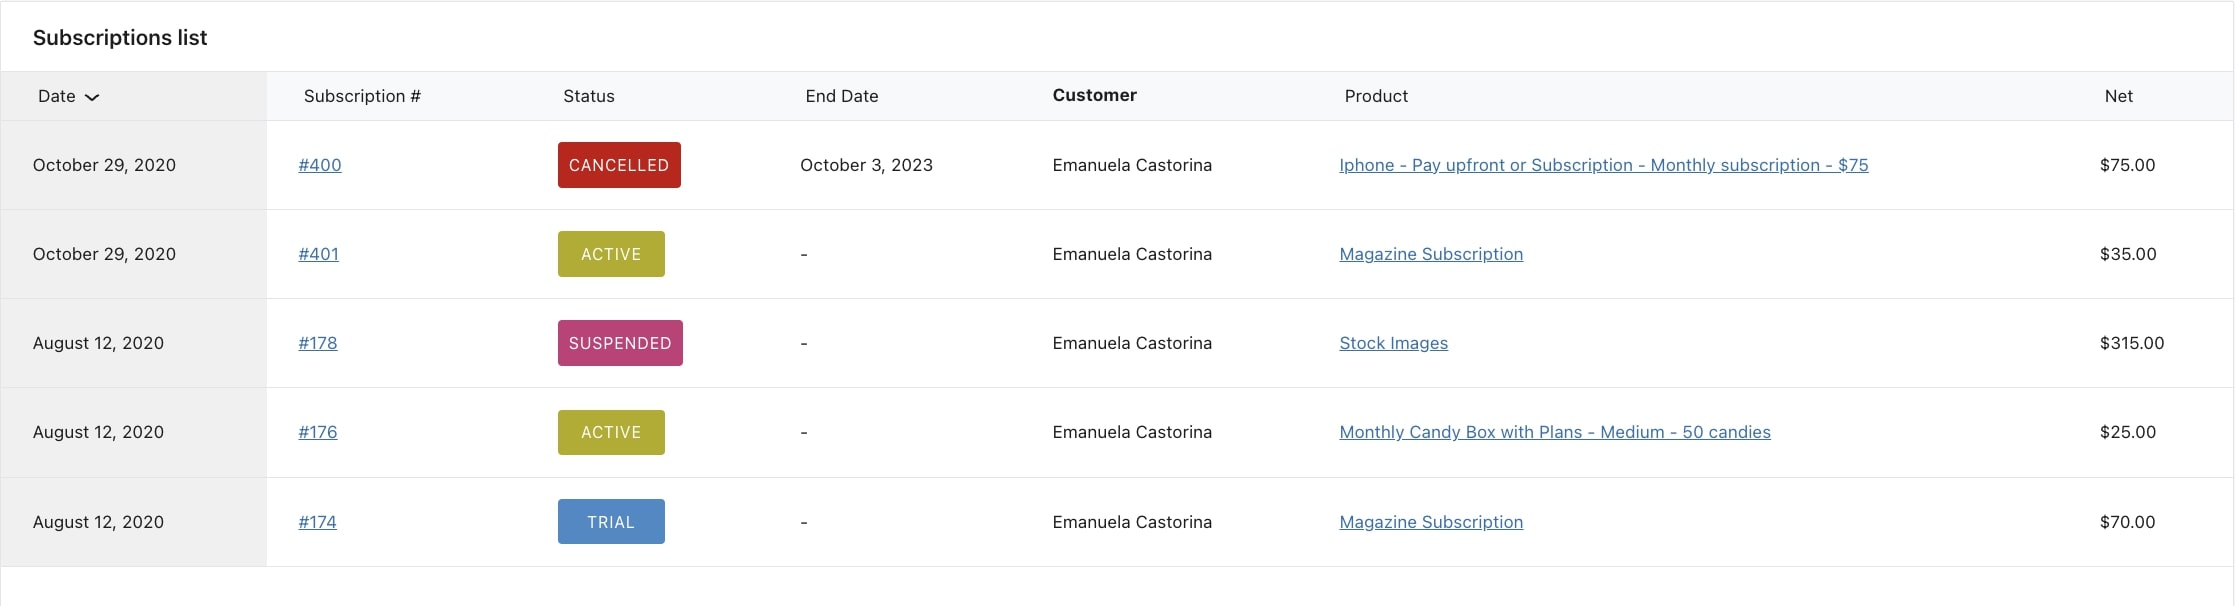
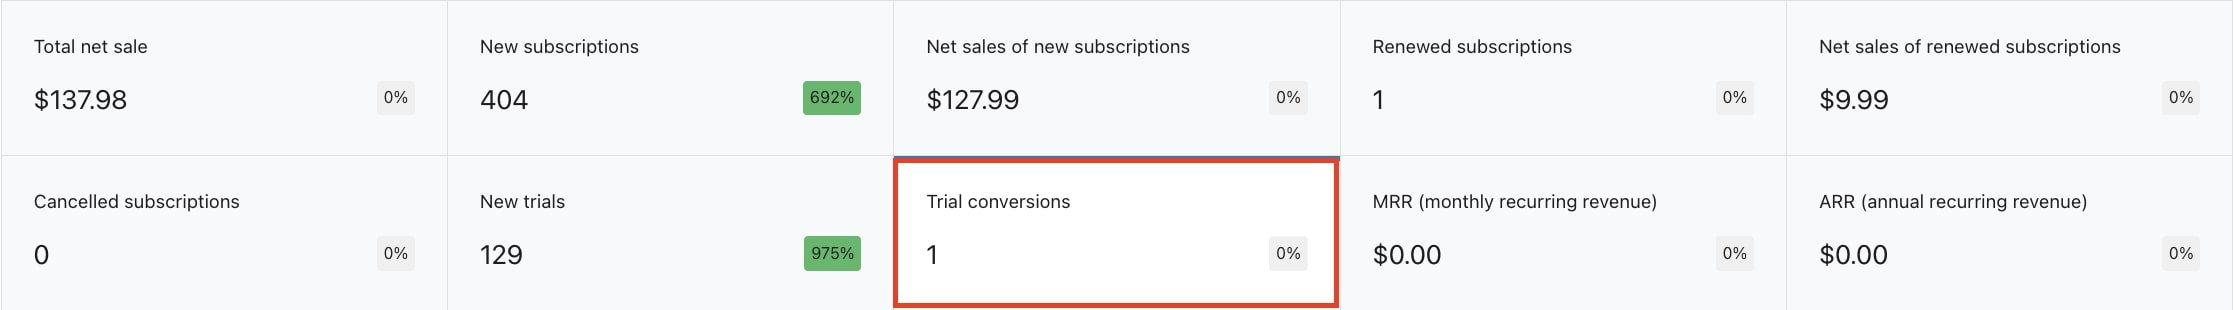
Under the graphic, the related list of all the subscriptions that produced sales will show. Each subscription will show the date, the subscription number (by clicking on it, you can access the subscription details), the status, end date, the customer who subscribed, the product linked to the subscription (by clicking on it, you can access the reports of that product), and the net income. This is how the Subscriptions list will show:
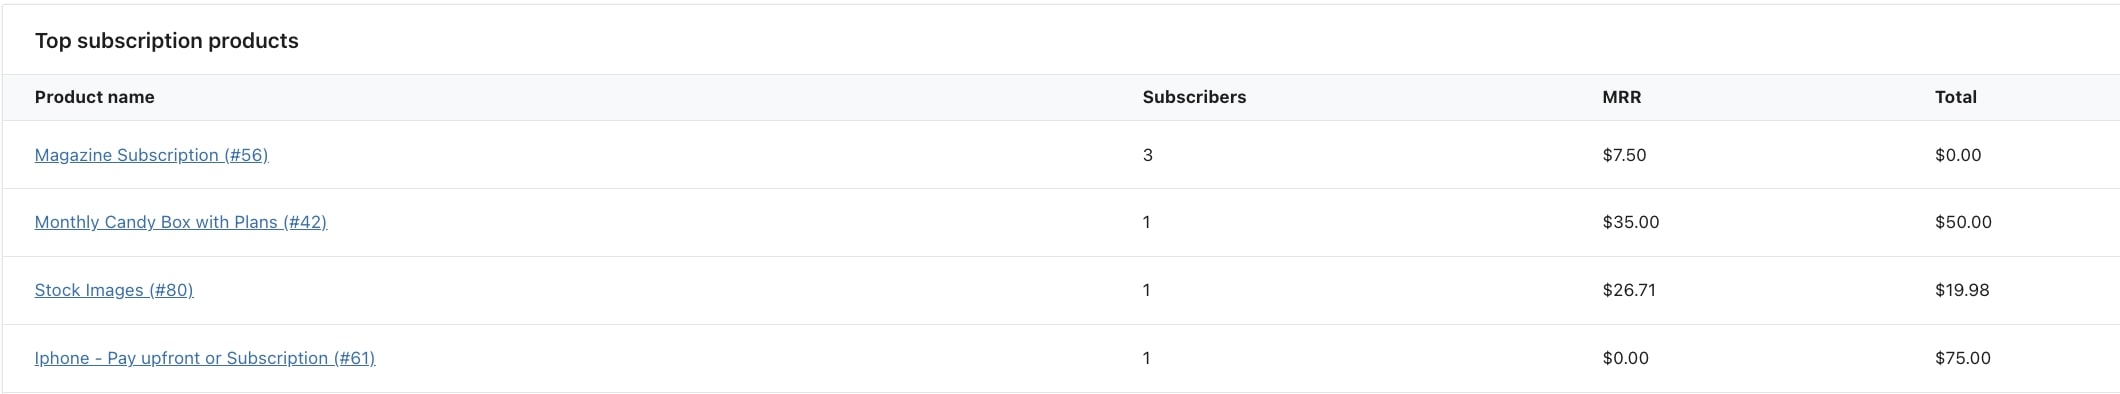
You will also have an overview of the most popular subscriptions sold in your store in the section Top subscription products.
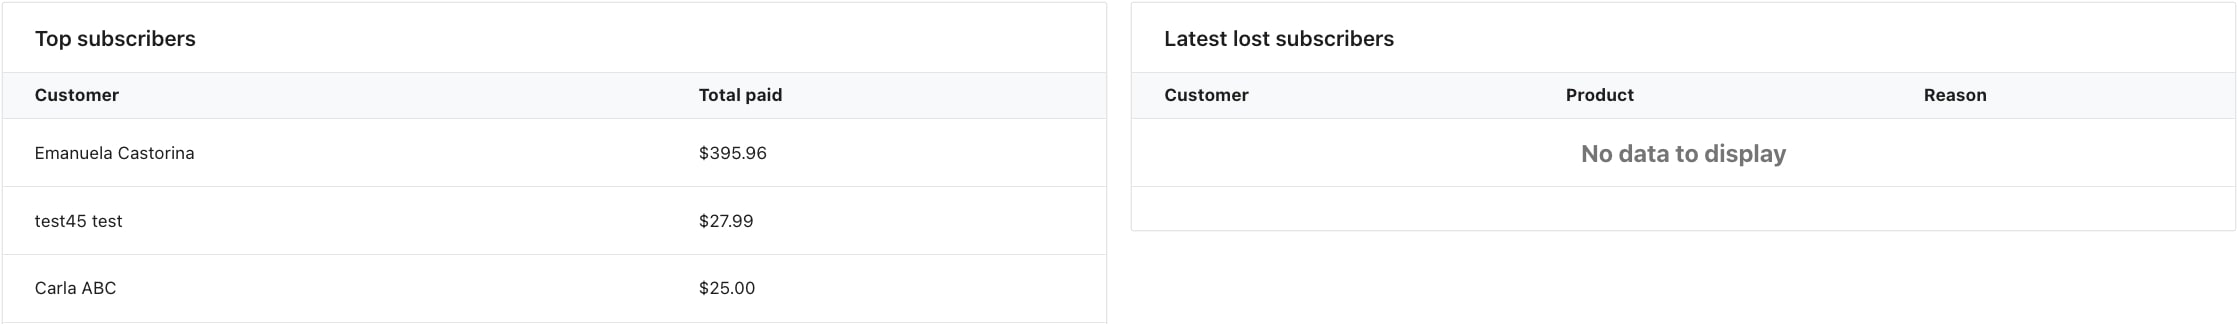
In addition to the subscription reports, you can also check which customers are the best subscribers, with the total amount they paid, and the lost subscribers, those with a canceled subscription. You can find this data in the Top subscribers and Latest lost subscribers sections.
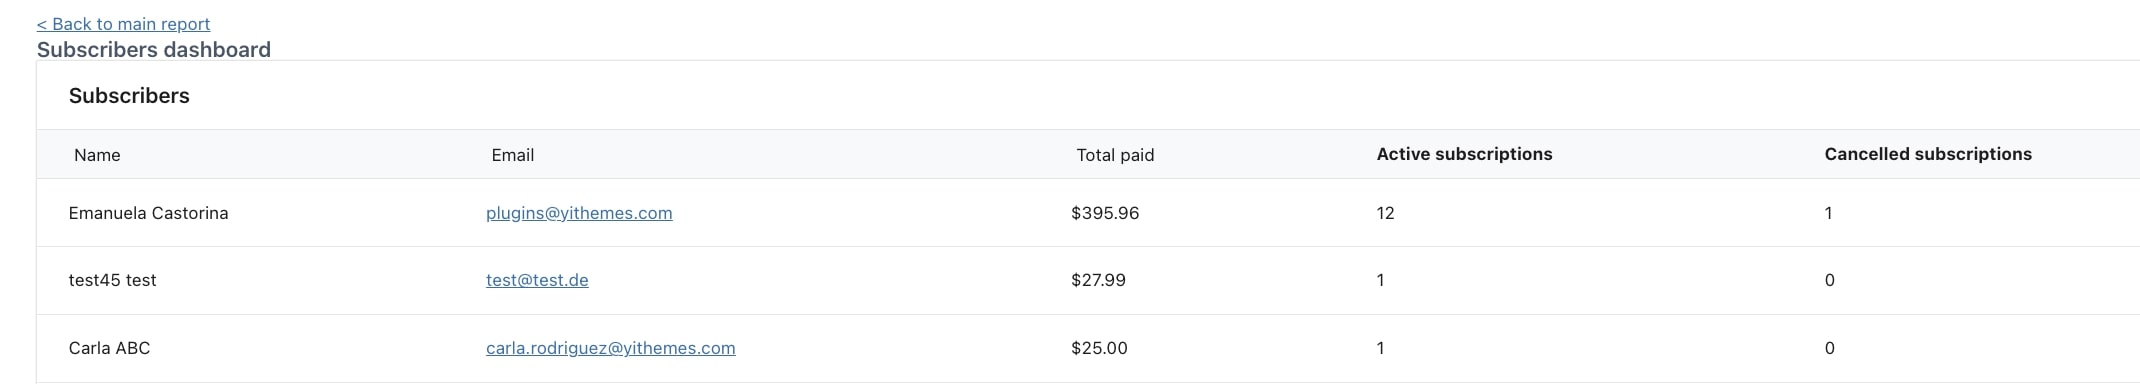
Click on View all to access the details of the Subscriber dashboard.
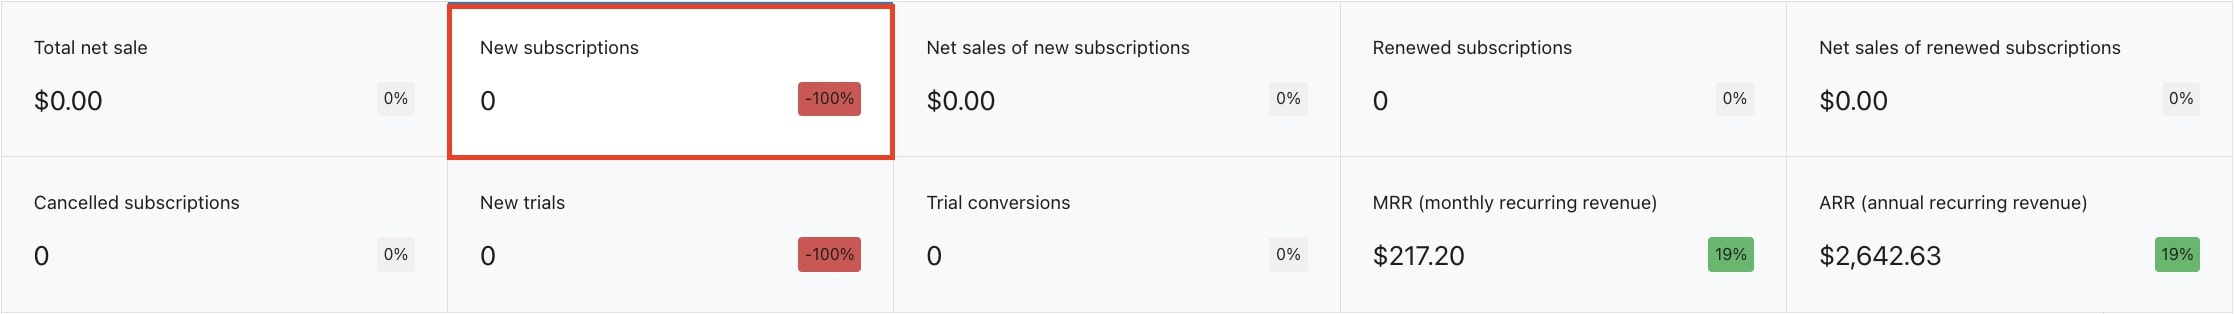
New subscriptions
The New subscriptions box allows viewing all the new subscriptions sold in the selected date range. The same number of subscriptions shown in the box will be listed under the Subscriptions list under the graphic.
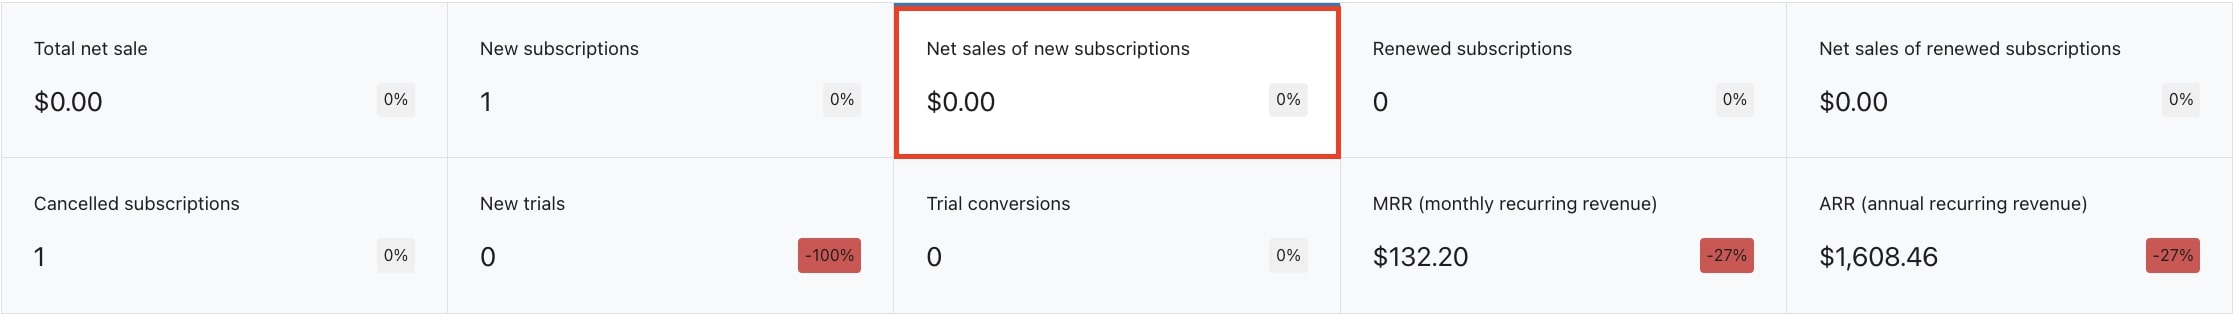
Net sales of new subscriptions
The box Net sales of new subscriptions shows the net amount earned with the new subscriptions based on the selected date range. You will find the list of new subscriptions in the section Subscriptions list, under the graphic.
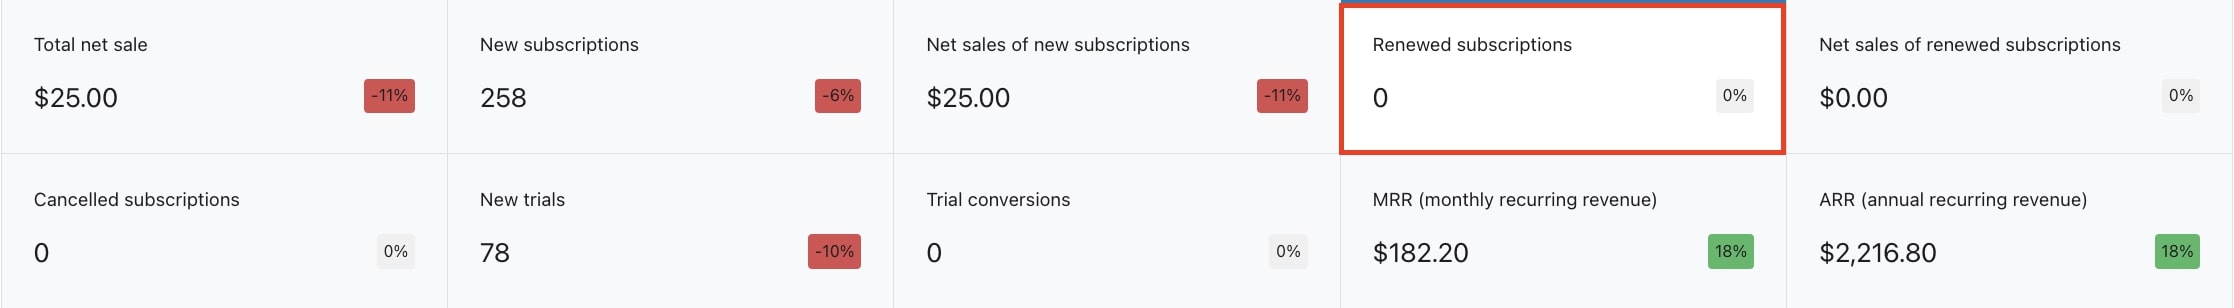
Renewed subscriptions
To check all the subscription renewals for a specific date range, refer to the box Renewed subscriptions. The Subscriptions list will reflect this data.
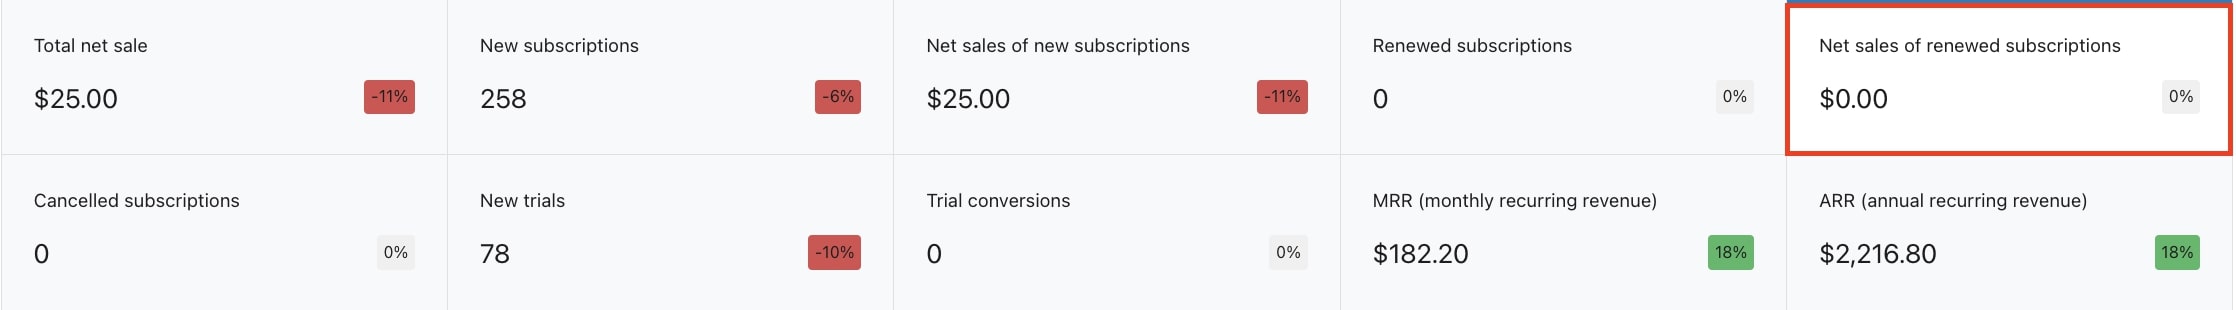
Net sales of renewed subscriptions
This box will show the net incomes coming from renewed subscriptions. As for the other reports, you will find the details in the Subscriptions list on the same page.
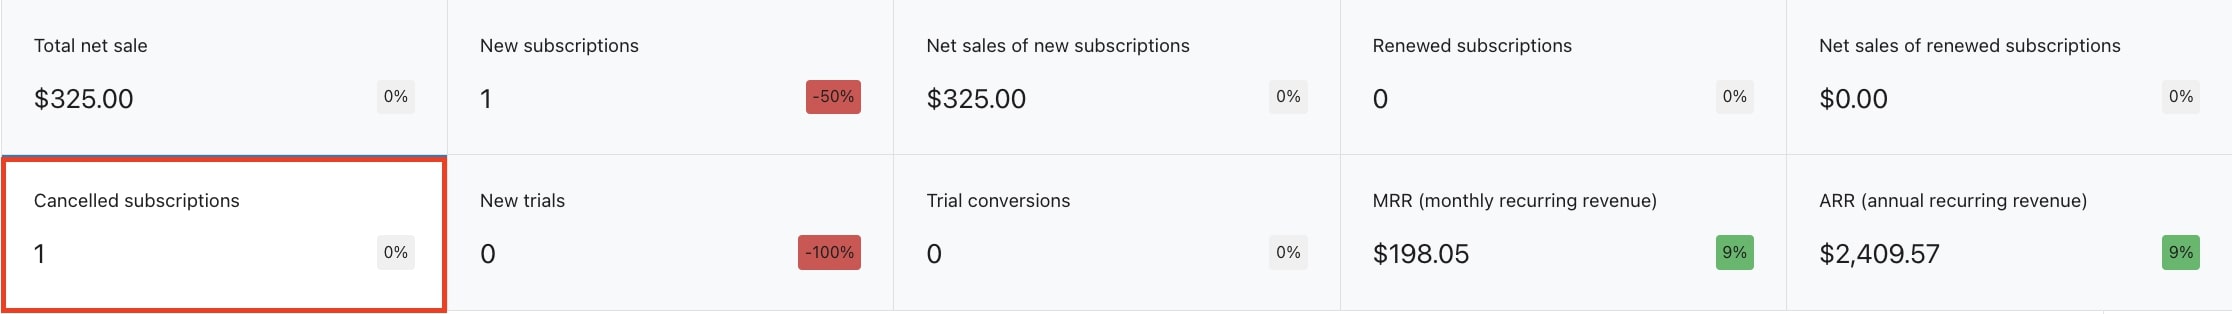
Cancelled subscriptions
You can check all the canceled subscriptions for a specific date range through the box Cancelled subscriptions. The data will reflect in the Subscriptions list that will show the subscription end date too.
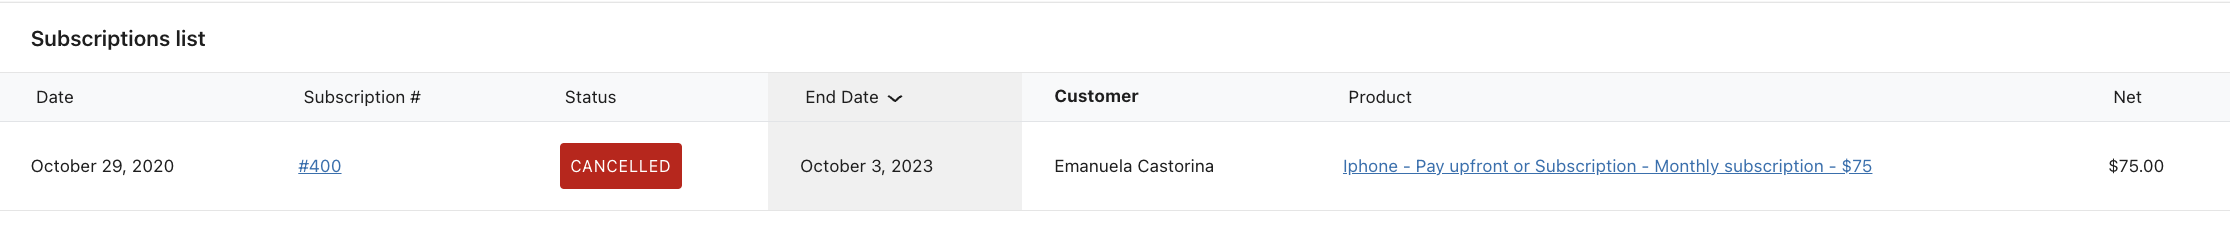
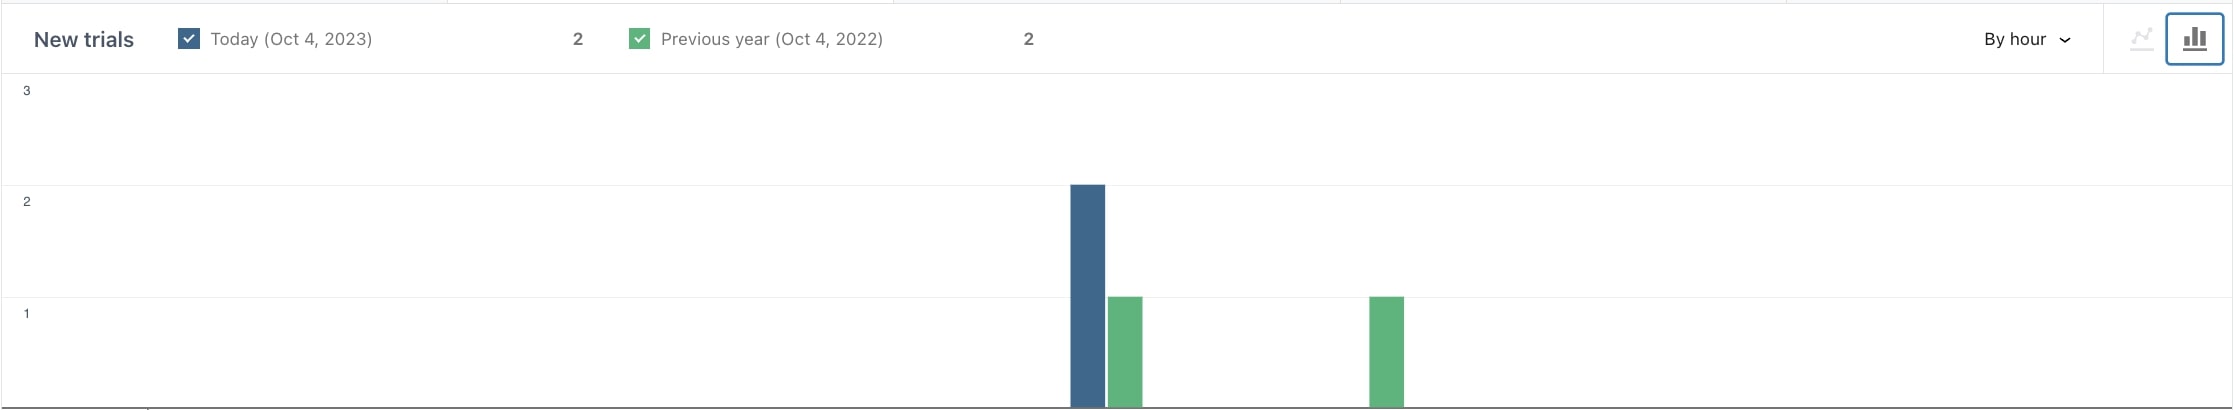
New trials
If you offer a trial period for one or more of your subscriptions, the New trials box will show you the trials started in the selected date range. On the contrary, the Subscriptions list will include only the trials currently available.
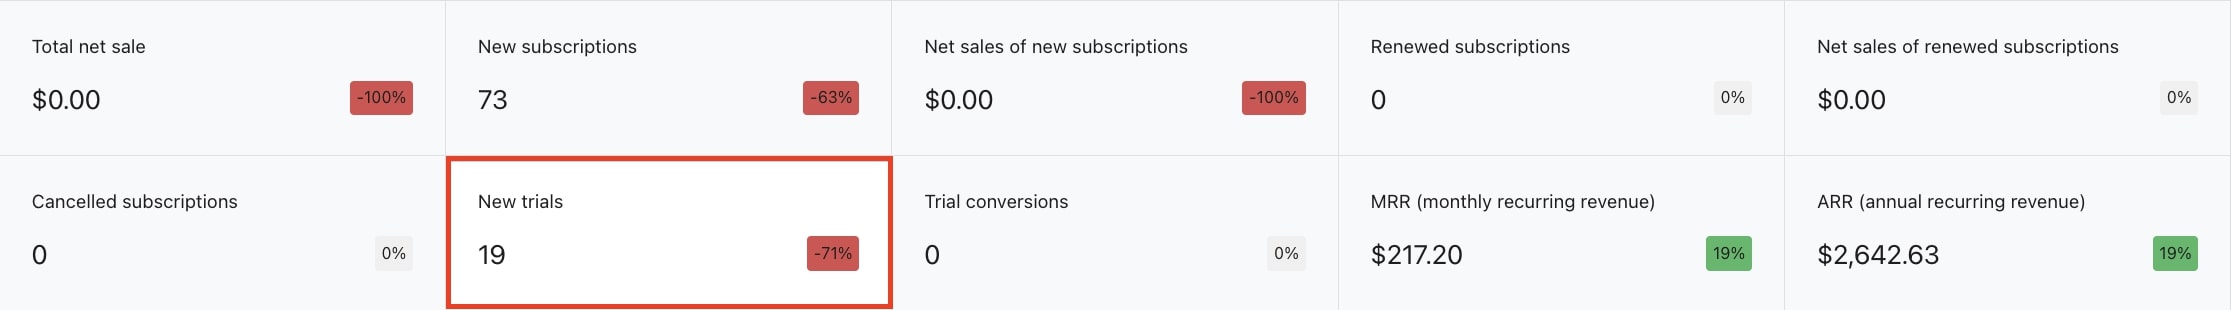
Trial conversions
The report in the Trial conversions box shows the number of subscriptions including a trial period that was converted into an active subscription.

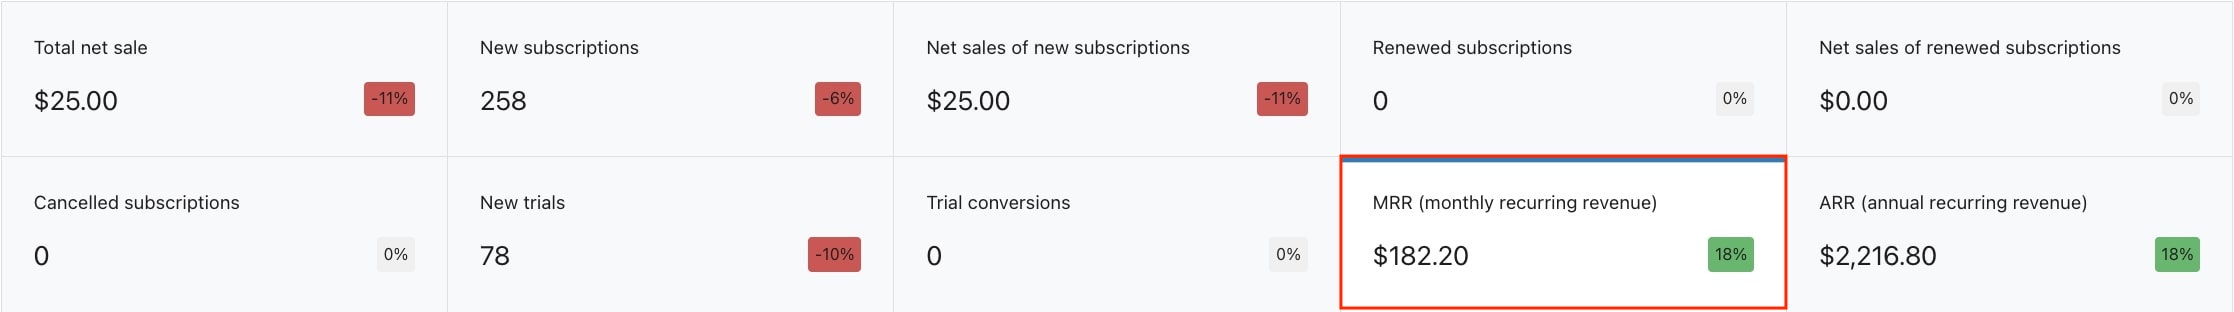
MRR (Monthly Recurring Revenue)
To track the average incomes and know how much money your subscription plans and billing periods are bringing in month by month, you can take advantage of the data shown in the box MRR (Monthly Recurring Revenue). This data helps you measure the effects of any changes to products or pricing you apply also at different times of the year.
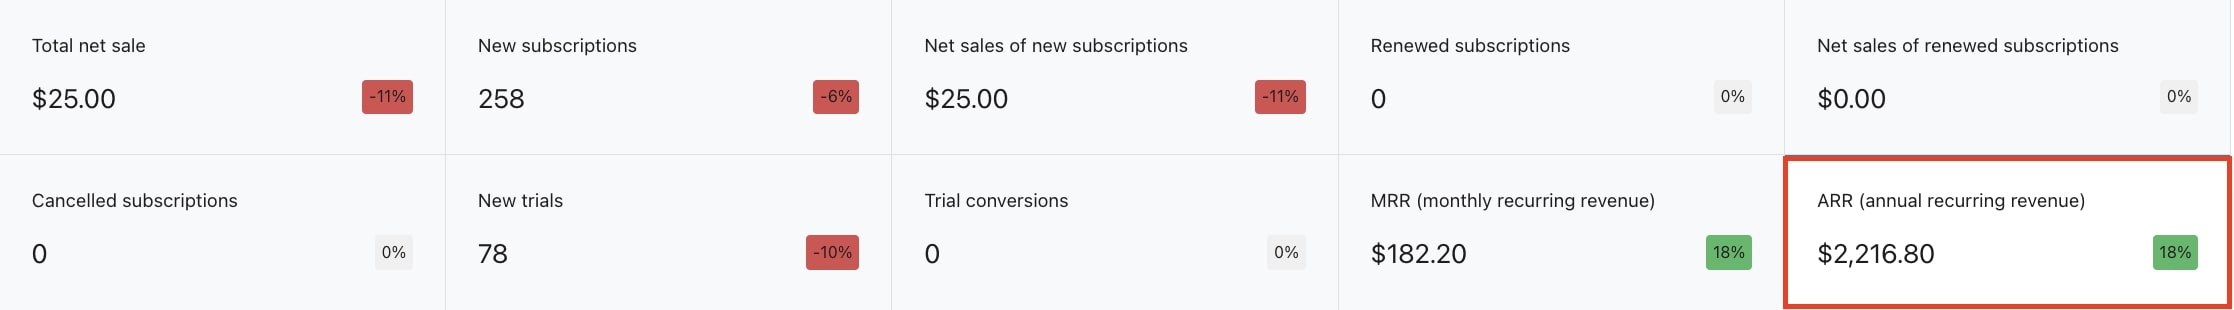
ARR (Annual Recurring Revenue)
Just like for the MRR, you can also check the metric about how much recurring revenue you can expect based on yearly subscriptions in the ARR (Annual Recurring Revenue) box. Based on ARR data, you will have a picture of your company incomes and plan business strategies in the future.
Additional options
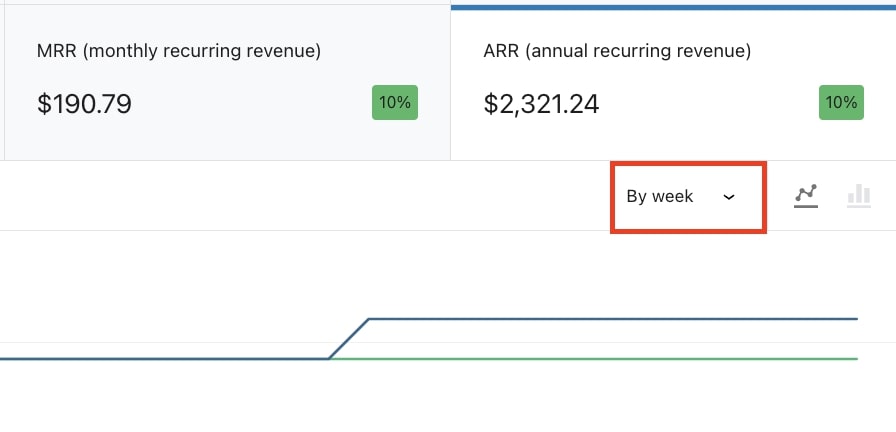
Based on the date range selected and the Previous period checkbox enabled or disabled, you will be able to show the graphic by day, week, month, or quarter and get a result like shown below.
You can also choose to show the graphic as a Line chart or Bar chart.
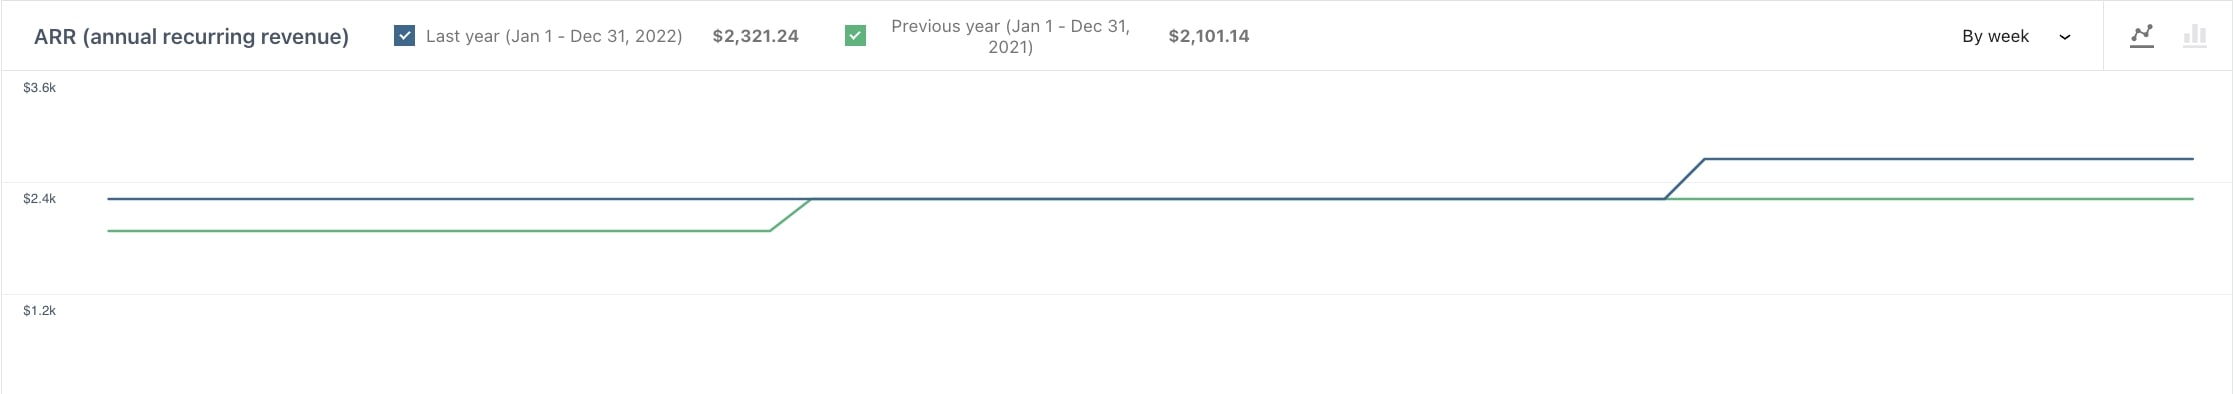
Line chart
Bar chart
In the Subscriptions list, you have the option to show the Net column data in ascending or descending order.